Heatmaps
Heatmap tool that shows where attention goes and where it stops
A heatmap tool turns thousands of visits into one picture of a page: where people click, how far they scroll and what they ignore. UserExplorer builds click, scroll and move heatmaps for any page and segment, then links each hot spot to the replays behind it.
- Click, scroll and move heatmaps on every plan
- Separate maps for desktop, tablet and phone
- Segment by source, campaign or user property
- Rage and dead clicks shown as their own layer

Why heatmaps
One page, thousands of visits, a single picture
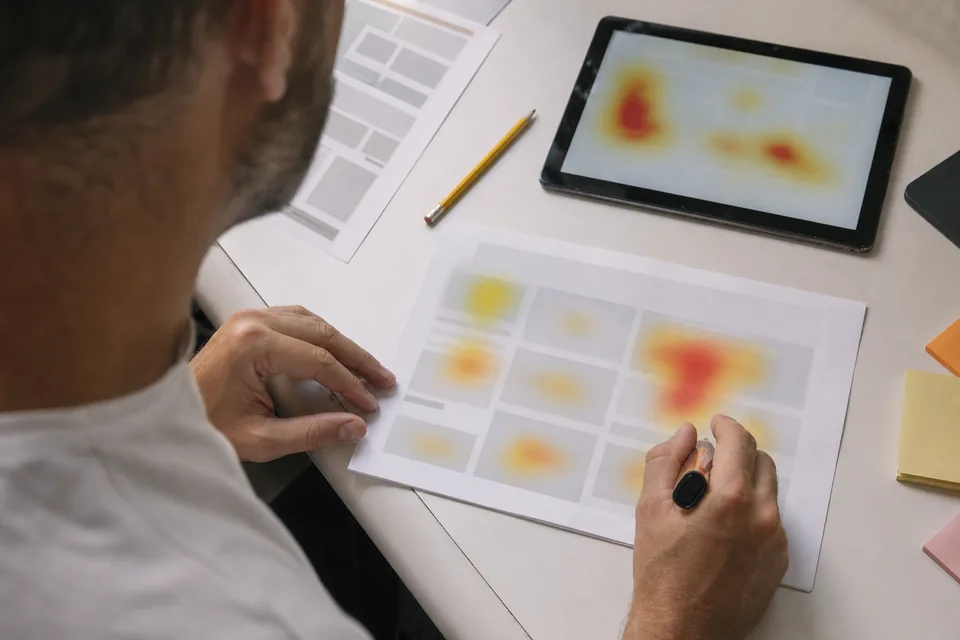
Analytics reports tell you a page has a 58 percent exit rate. Heatmaps for websites tell you what people did before they left: they clicked a product photo that does not open, scrolled past the size guide or never reached the call to action that sits below the fold on small laptops.
Because the map is built from recorded page structure rather than screenshots, it stays accurate after you change copy, swap a banner or show different content to logged in users. Dynamic menus, tabs and modals are captured in the state the visitor saw.
A heatmap is a starting point. Click any hot spot to open the session replays that produced it, or compare two segments side by side to see how paid visitors read the page differently from returning customers.
Map types
Six ways to read the same page
Click heatmap
Every click and tap aggregated by element, with counts and share of visitors on hover.
Scroll heatmap
Shows the share of visitors who reached each depth, so you know what is actually seen.
Move heatmap
Mouse movement on desktop, a useful hint of reading patterns on long pages.
Frustration layer
Highlights rage clicks and dead clicks on top of the map. More on rage click tracking.
Device split
Desktop, tablet and phone maps are separate, because layouts and habits differ.
Compare segments
Put two segments or two date ranges next to each other to see the effect of a change.
Mobile first
Phone visitors read your page differently
On many commerce and SaaS sites most traffic is mobile, yet pages are still reviewed on a large monitor. The phone heatmap shows taps on elements that are not links, thumbs that never reach a sticky bar and filter drawers that open and close without a choice.
Combine the map with form analytics on checkout and you see both where shoppers hesitate on the page and which field makes them give up.
Reach
Only 41% see the feature table on mobile.
Sample data
Getting a map
From snippet to first heatmap in an afternoon
-
Step 1
Install once
Add the UserExplorer snippet to your site. Heatmaps use the same recording as replays, nothing extra to tag.
-
Step 2
Pick a page
Enter a URL or a URL pattern, for example all product pages, to aggregate similar pages into one map.
-
Step 3
Choose a segment
Filter by device, traffic source, country or any event, and select the date range.
-
Step 4
Read and act
Open replays from hot spots, export the map or ask the AI researcher what the pattern means.
Compared
What to look for in heatmap software
| Capability | UserExplorer | Basic heatmap tools |
|---|---|---|
| Click, scroll and move maps | Yes | Usually yes |
| Maps for dynamic and logged in pages | Yes, from recorded page structure | Sometimes limited to static pages |
| Rage and dead click layer | Yes | Varies |
| Jump from hot spot to replays | Yes | Varies |
| Segments shared with funnels and AI | Yes | Separate filters |
| Masking of inputs by default | Yes | Varies |
-
Click, scroll and move maps
- UserExplorer
- Yes
- Basic heatmap tools
- Usually yes
-
Maps for dynamic and logged in pages
- UserExplorer
- Yes, from recorded page structure
- Basic heatmap tools
- Sometimes limited to static pages
-
Rage and dead click layer
- UserExplorer
- Yes
- Basic heatmap tools
- Varies
-
Jump from hot spot to replays
- UserExplorer
- Yes
- Basic heatmap tools
- Varies
-
Segments shared with funnels and AI
- UserExplorer
- Yes
- Basic heatmap tools
- Separate filters
-
Masking of inputs by default
- UserExplorer
- Yes
- Basic heatmap tools
- Varies
General comparison, check each vendor for its current features and prices.
FAQ
Questions teams ask before they start
What is a heatmap tool?
A heatmap tool aggregates clicks, taps, scrolling and mouse movement from many visits and paints them over a page, so you can see at a glance which elements get attention and which are ignored.
Which heatmap types does UserExplorer include?
Click, scroll and move heatmaps, a frustration layer with rage and dead clicks, device splits and side by side comparison of segments or date ranges.
Do heatmaps work on single page apps and logged in areas?
Yes. Maps are built from the recorded page structure, so dashboards, modals and pages behind login are mapped in the state visitors saw them.
Can I combine several URLs into one heatmap?
Yes. Use a URL pattern, for example every product page, and the map aggregates similar pages into one view.
Are heatmaps included in every plan?
Yes. Heatmaps are part of Startup, Growth, Scale and Enterprise and use the monthly session limit of your plan. See pricing.
How many visits do I need for a useful heatmap?
A few hundred visits to a page usually show clear patterns. Low traffic pages can use a longer date range or a URL pattern.
See the reason behind your numbers this week
Install one snippet, record real sessions with masking on by default, and let the AI researcher show you what to fix first.